
Markets went for a wild ride last week - especially on Friday. In fact, on December 1, the S&P 500 had its largest fluctuations since the day after the 2016 presidential election.[1]
Nonetheless, two of the major domestic markets hit new record highs on Thursday and ended the week with sizable gains. The S&P 500 added 1.53% and the Dow gained 2.86%.[2] Meanwhile, the NASDAQ lost 0.60% and international stocks in the MSCI EAFE gave back 0.95%.[3]
What drove markets last week?
Politics played a large role in market performance last week with big developments on tax reform and the Russia investigation.[4]
Tax Reform
On Thursday, news that the Senate bill was more likely to pass contributed to the Dow and S&P 500 closing at record highs.[5] Early Saturday morning, the Senate did end up voting in favor of the proposal.[6]Russia Investigation
On Friday, stocks dropped on news that former National Security Adviser Michael Flynn pleaded guilty to charges of lying to the FBI.[7]
While politics grabbed many of the headlines, we also received economic updates that are worth noting:
Gross Domestic Product
We received the 2nd GDP reading for July - October, and the report came back higher than expected. During the 3rd quarter, the economy grew at 3.3%, which is its quickest pace in 3 years.[8]Housing Sales
New home sales beat expectations in the most recent report and increased 18.7% year over year. The sales were higher than they've been in a decade.[9]Consumer Spending
Americans spent and earned more money in October, according to the data we received last week.[10]
What should you focus on?
Political developments are affecting daily market performance, so we understand the interest they hold. While you may be following these reports, we also want to ensure you recognize the economic data coming forward, too.
We cannot predict what will happen with tax reform or the Russia investigation. However, we can continue to monitor them while focusing on what's really happening in the economy beyond the headlines. If you ever have questions about how current events may affect your financial life, please contact us any time.
ECONOMIC CALENDAR
Monday: Factory Orders
Tuesday: ISM Non-Mfg Index
Wednesday: ADP Employment Report
Thursday: Jobless Claims
Friday: Consumer Sentiment
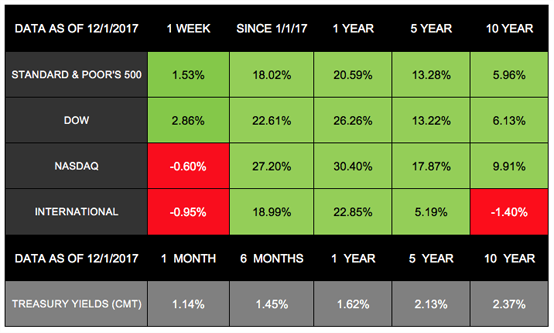
Notes: All index returns (except S&P 500) exclude reinvested dividends, and the 5- year and 10-year returns are annualized. The total returns for the S&P 500 assume reinvestment of dividends on the last day of the month. This may account for differences between the index returns published on Morningstar.com and the index returns published elsewhere. International performance is represented by the MSCI EAFE Index. Past performance is no guarantee of future results. Indices are unmanaged and cannot be invested into directly.
These are the views of Platinum Advisor Marketing Strategies, LLC, and not necessarily those of the named representative, Broker dealer or Investment Advisor, and should not be construed as investment advice. Neither the named representative nor the named Broker dealer or Investment Advisor gives tax or legal advice. All information is believed to be from reliable sources; however, we make no representation as to its completeness or accuracy. Please consult your financial advisor for further information.
Investing involves risk including the potential loss of principal. No investment strategy can guarantee a profit or protect against loss in periods of declining values.
Diversification does not guarantee profit nor is it guaranteed to protect assets.
International investing involves special risks such as currency fluctuation and political instability and may not be suitable for all investors.
The Standard & Poor's 500 (S&P 500) is an unmanaged group of securities considered to be representative of the stock market in general.
The Dow Jones Industrial Average is a price-weighted average of 30 significant stocks traded on the New York Stock Exchange and the NASDAQ. The DJIA was invented by Charles Dow back in 1896.
The Nasdaq Composite is an index of the common stocks and similar securities listed on the NASDAQ stock market and is considered a broad indicator of the performance of stocks of technology companies and growth companies.
The MSCI EAFE Index was created by Morgan Stanley Capital International (MSCI) that serves as a benchmark of the performance in major international equity markets as represented by 21 major MSCI indexes from Europe, Australia and Southeast Asia.
The Dow Jones Corporate Bond Index is a 96-bond index designed to represent the market performance, on a total-return basis, of investment-grade bonds issued by leading U.S. companies. Bonds are equally weighted by maturity cell, industry sector, and the overall index.
The S&P US Investment Grade Corporate Bond Index contains US- and foreign issued investment grade corporate bonds denominated in US dollars. The SPUSCIG launched on April 9, 2013. All information for an index prior to its launch date is back teased, based on the methodology that was in effect on the launch date. Back-tested performance, which is hypothetical and not actual performance, is subject to inherent limitations because it reflects application of an Index methodology and selection of index constituents in hindsight. No theoretical approach can take into account all of the factors in the markets in general and the impact of decisions that might have been made during the actual operation of an index. Actual returns may differ from, and be lower than, back tested returns.
The S&P/Case-Shiller Home Price Indices are the leading measures of U.S. residential real estate prices, tracking changes in the value of residential real estate. The index is made up of measures of real estate prices in 20 cities and weighted to produce the index.
The 10-year Treasury Note represents debt owed by the United States Treasury to the public. Since the U.S. Government is seen as a risk-free borrower, investors use the 10-year Treasury Note as a benchmark for the long-term bond market.
Google Finance is the source for any reference to the performance of an index between two specific periods.
Opinions expressed are subject to change without notice and are not intended as investment advice or to predict future performance.
Past performance does not guarantee future results.
You cannot invest directly in an index.
Consult your financial professional before making any investment decision.
Fixed income investments are subject to various risks including changes in interest rates, credit quality, inflation risk, market valuations, prepayments, corporate events, tax ramifications and other factors.
By clicking on these links, you will leave our server, as they are located on another server. We have not independently verified the information available through this link. The link is provided to you as a matter of interest. Please click on the links below to leave and proceed to the selected site.